Health Insurance

r
tidyverse
data-analytics
health-insurance
Author

Marcus Smith

Published

May 5, 2024

Let’s analyze the health_ins data:

library(tidyverse)
library(skimr)
mpg
# A tibble: 234 × 11
   manufacturer model      displ  year   cyl trans drv     cty   hwy fl    class
   <chr>        <chr>      <dbl> <int> <int> <chr> <chr> <int> <int> <chr> <chr>
 1 audi         a4           1.8  1999     4 auto… f        18    29 p     comp…
 2 audi         a4           1.8  1999     4 manu… f        21    29 p     comp…
 3 audi         a4           2    2008     4 manu… f        20    31 p     comp…
 4 audi         a4           2    2008     4 auto… f        21    30 p     comp…
 5 audi         a4           2.8  1999     6 auto… f        16    26 p     comp…
 6 audi         a4           2.8  1999     6 manu… f        18    26 p     comp…
 7 audi         a4           3.1  2008     6 auto… f        18    27 p     comp…
 8 audi         a4 quattro   1.8  1999     4 manu… 4        18    26 p     comp…
 9 audi         a4 quattro   1.8  1999     4 auto… 4        16    25 p     comp…
10 audi         a4 quattro   2    2008     4 manu… 4        20    28 p     comp…
# ℹ 224 more rows
health_cust <- read_csv(
  'https://bcdanl.github.io/data/custdata_rev.csv'
)

Variable Description for health_ins data.frame

The following describes the variables in the health_ins data.frame.

  • custid: ID of customer
  • sex: Sex
  • is_employed: Employment status
    • NA: Unknown or not applicable
    • TRUE: Employed
    • FALSE: Unemployed
  • income: Income (in $)
  • marital_status: Marital status
  • housing_type: Housing type
  • recent_move:
    • TRUE: Recently moved
    • FALSE: Not recently moved
  • age: Age
  • state_of_res: State of residence
  • gas_usage: Gas usage
    • NA: Unknown or not applicable
    • 001: Included in rent or condo fee
    • 002: Included in electricity payment
    • 003: No charge or gas not used
    • 004-999: $4 to $999 (rounded and top-coded)
  • health_ins: Health insuarance status
    • TRUE: customer with health insuarance
    • FALSE: customer without health insuarance

Marital Status and Health Insurance

health_cust2 <- filter(health_cust, age > 0, age < 100, income > 0)
ggplot(data = health_cust2) +
  geom_bar(mapping = 
             aes(x = marital_status,
                 fill = health_ins),
           position = "dodge")

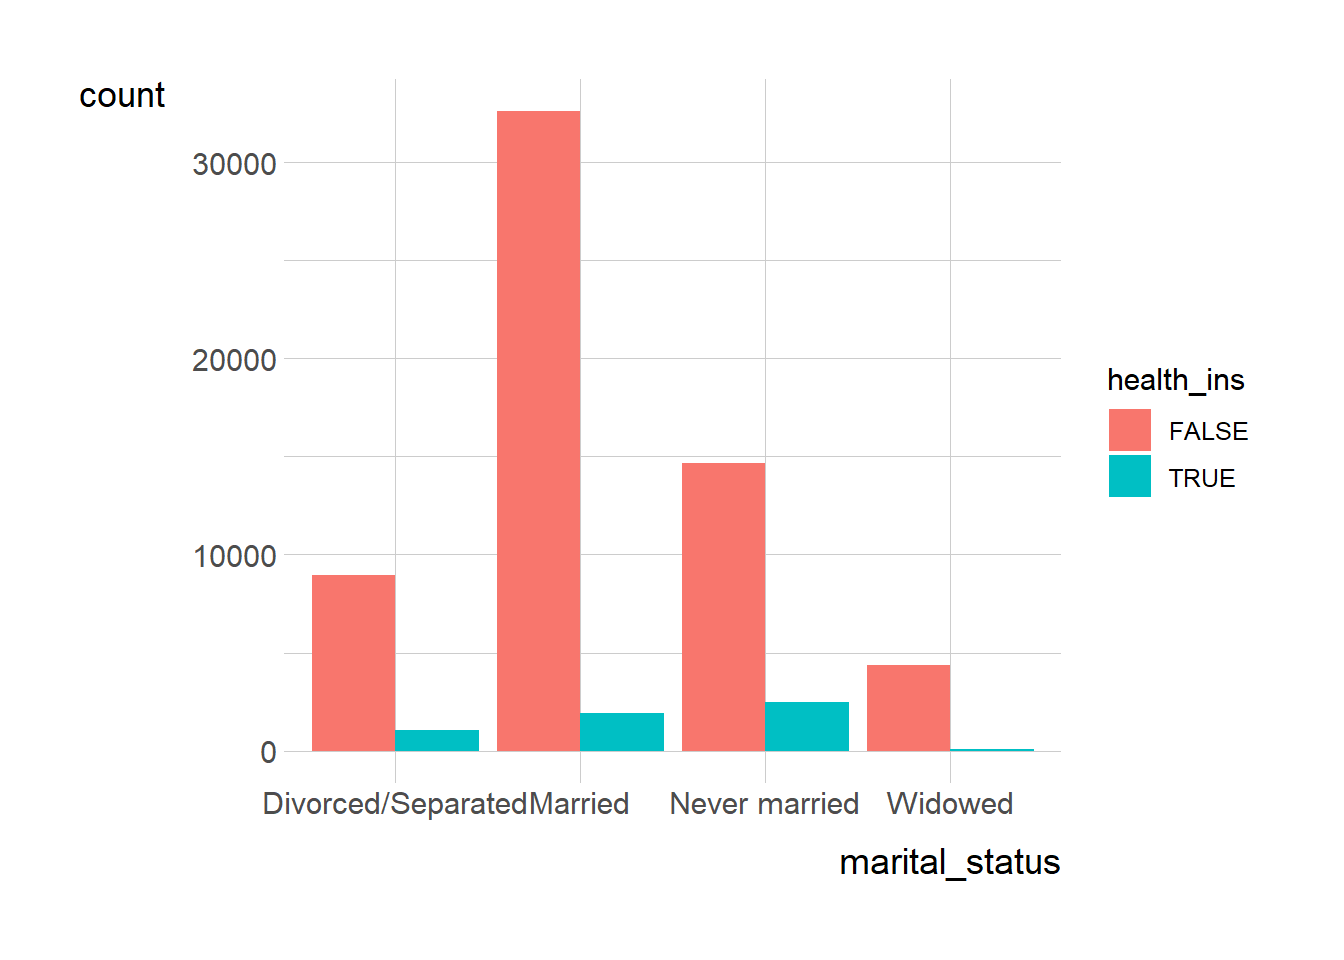
# Within all marital status categories, there are more customers without health insurance then there are with health insurance. That being said, there are approximately 320,000 married customers without health insurance and 20,000 with health insurance. Approximately, 150,000 never married customers without health insurance and 30,000 with health insurance. For widowed customer, there is approximately 5000 customers without health insurance, and less than 500 customers with health insurance. Lastly. there is approximately 9000 divorced/separated customers without health insurance and 1000 customers with health insurance.